Revenue Mix and Interest Income
I recently published a post highlighting the chasms companies inevitably have to cross as they grow – the leap from single product to multi, single revenue stream to multi, single geo to multi, horizontal vs. vertical, founder-led sales to scaled GTM, and many more. It acknowledged how painful these transitions can be.
This post aims to offer a broader perspective to those grappling with these challenges. Furthermore, it intends to serve as a valuable guide to early-stage founders strategizing their long-term growth blueprint. I dive deeper into the revenue compositions of various fintech companies at different stages of their growth and highlight the current value of interest income in the current [high-interest rate] environment – a meaningful revenue source for both public and private companies. As an aside, I'll eventually post on some modern companies (like those in Payments Plus) that aren't taking as straightforward of a path (and some privates like Rippling, Ramp, etc).
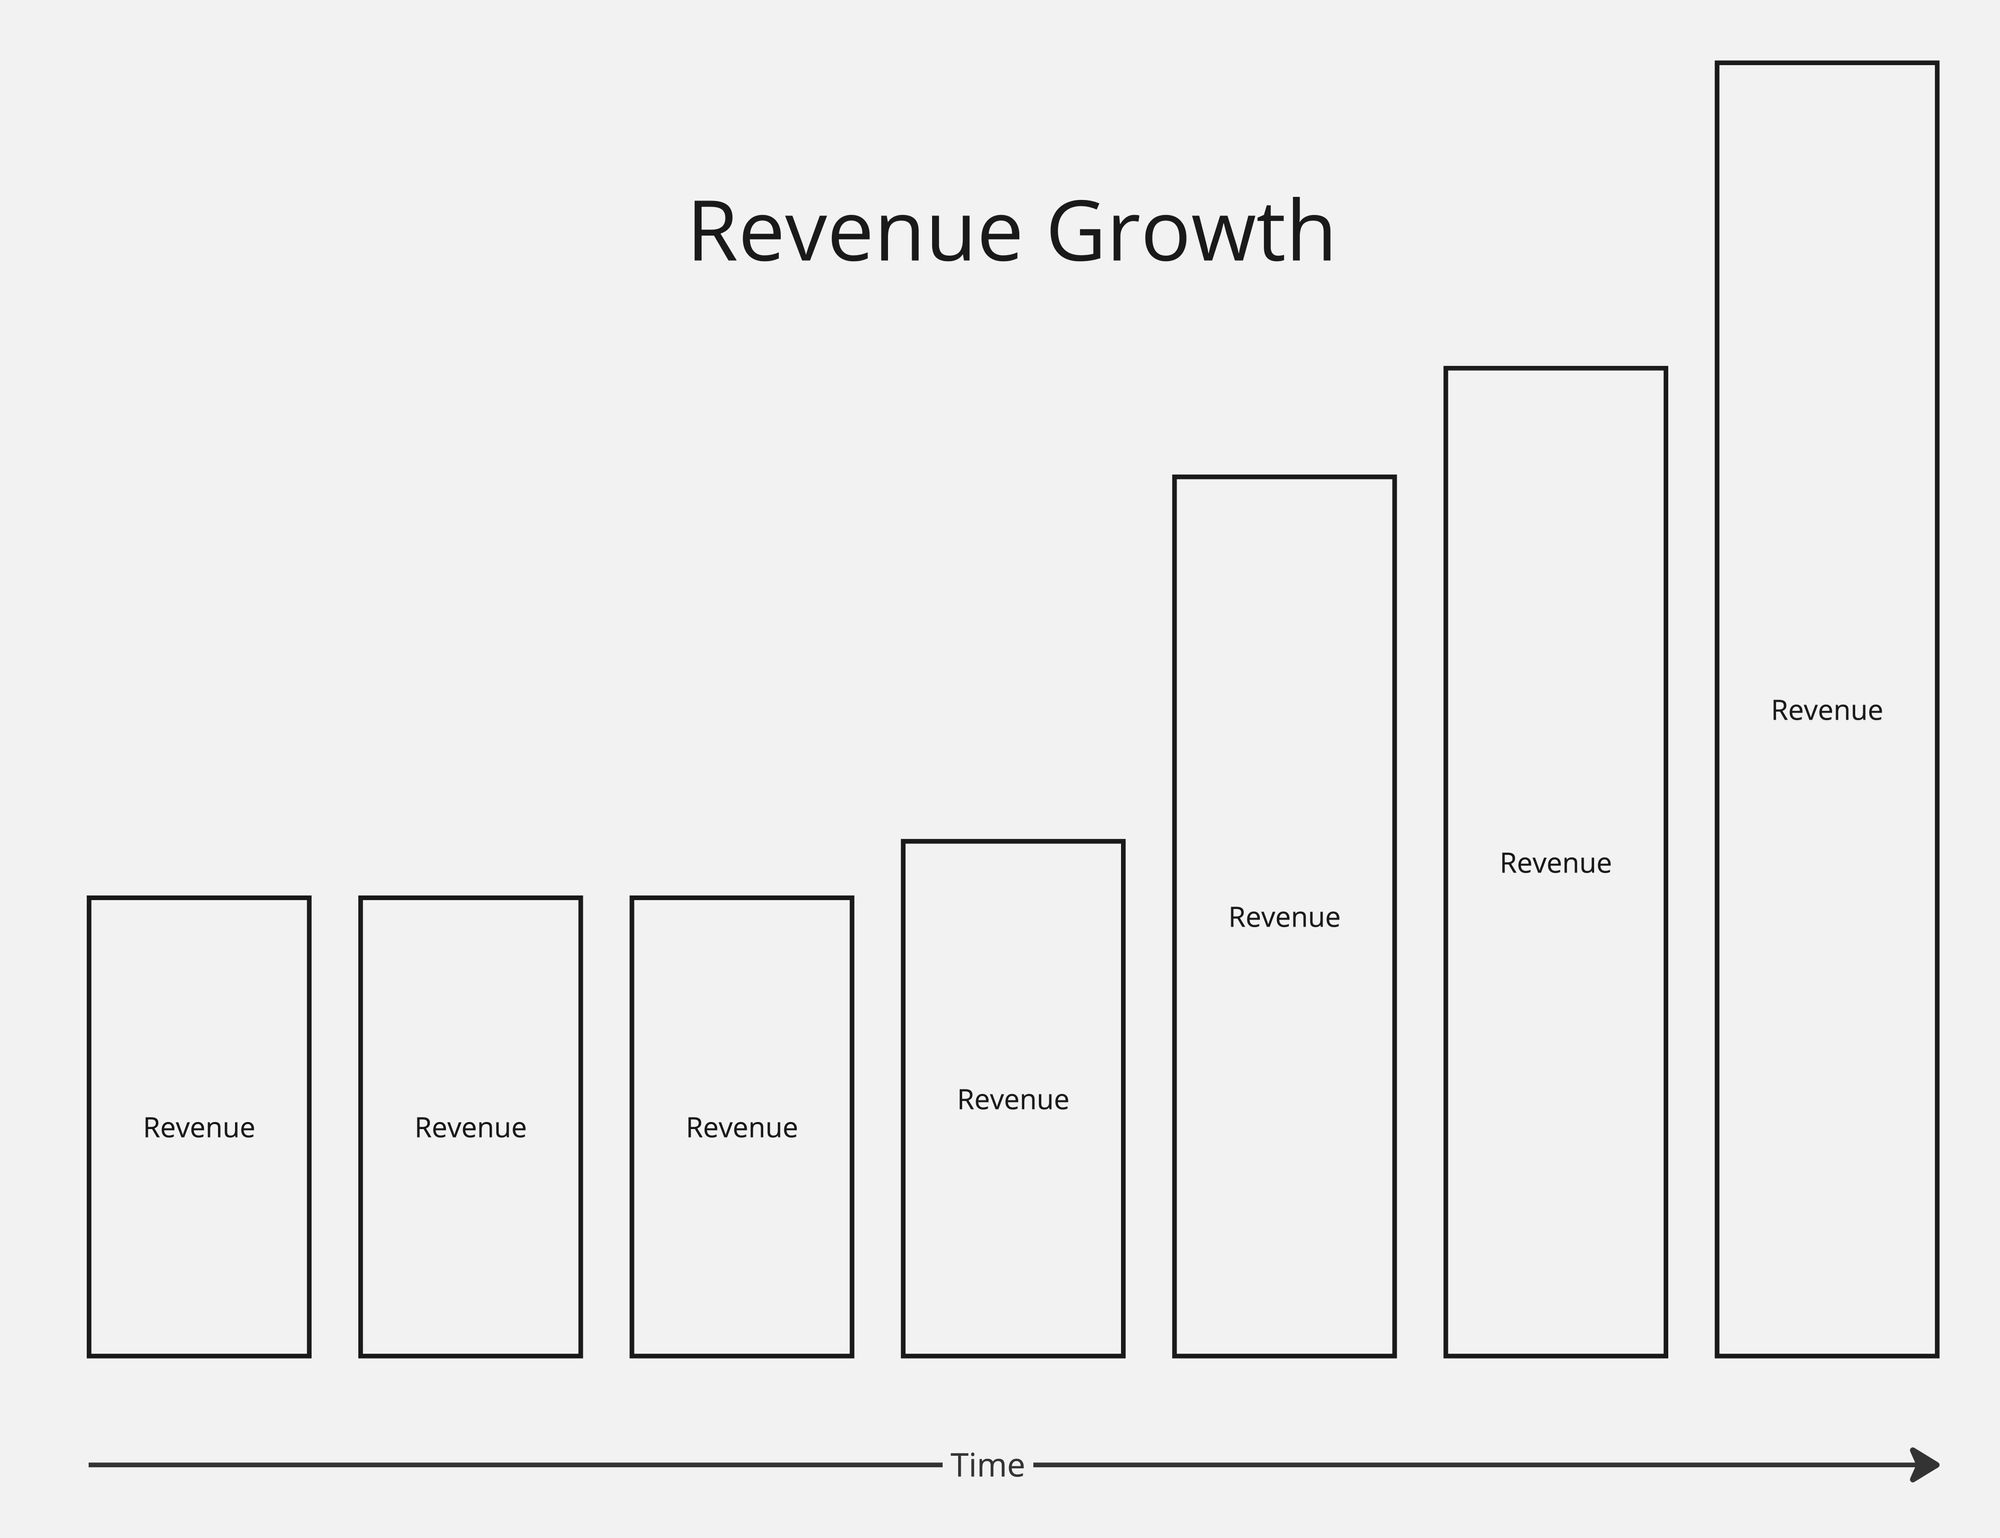
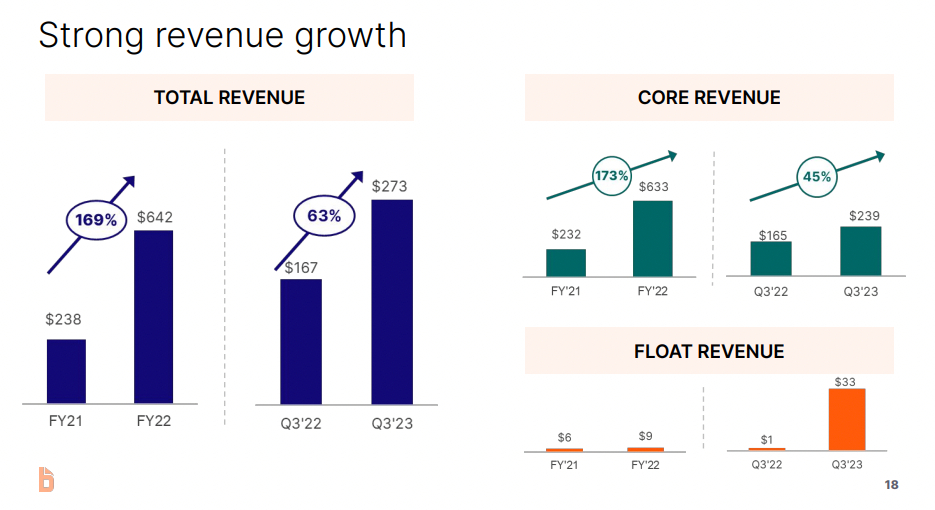
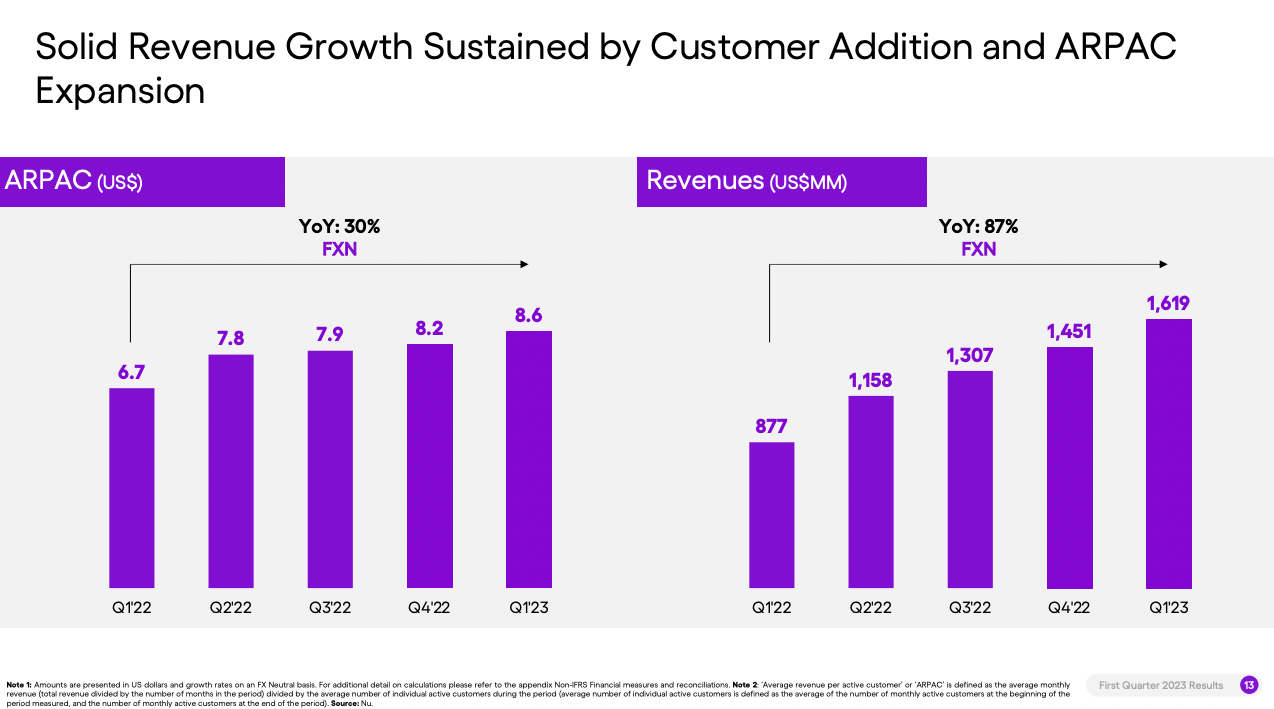
So, this bar chart looks good. The company is growing revenue. In some sectors, just beefing up sales and marketing may suffice for growing into a multibillion company. They'll likely get a rich, pure software multiple. Good for them. Highly unlikely to be the case for a fintech company, though. So the rest of this post highlights how they can continue diversifying and growing their revenue over time.
They'll introduce additional revenue streams over time. Maybe this coincides with new product launches, but maybe it doesn't.
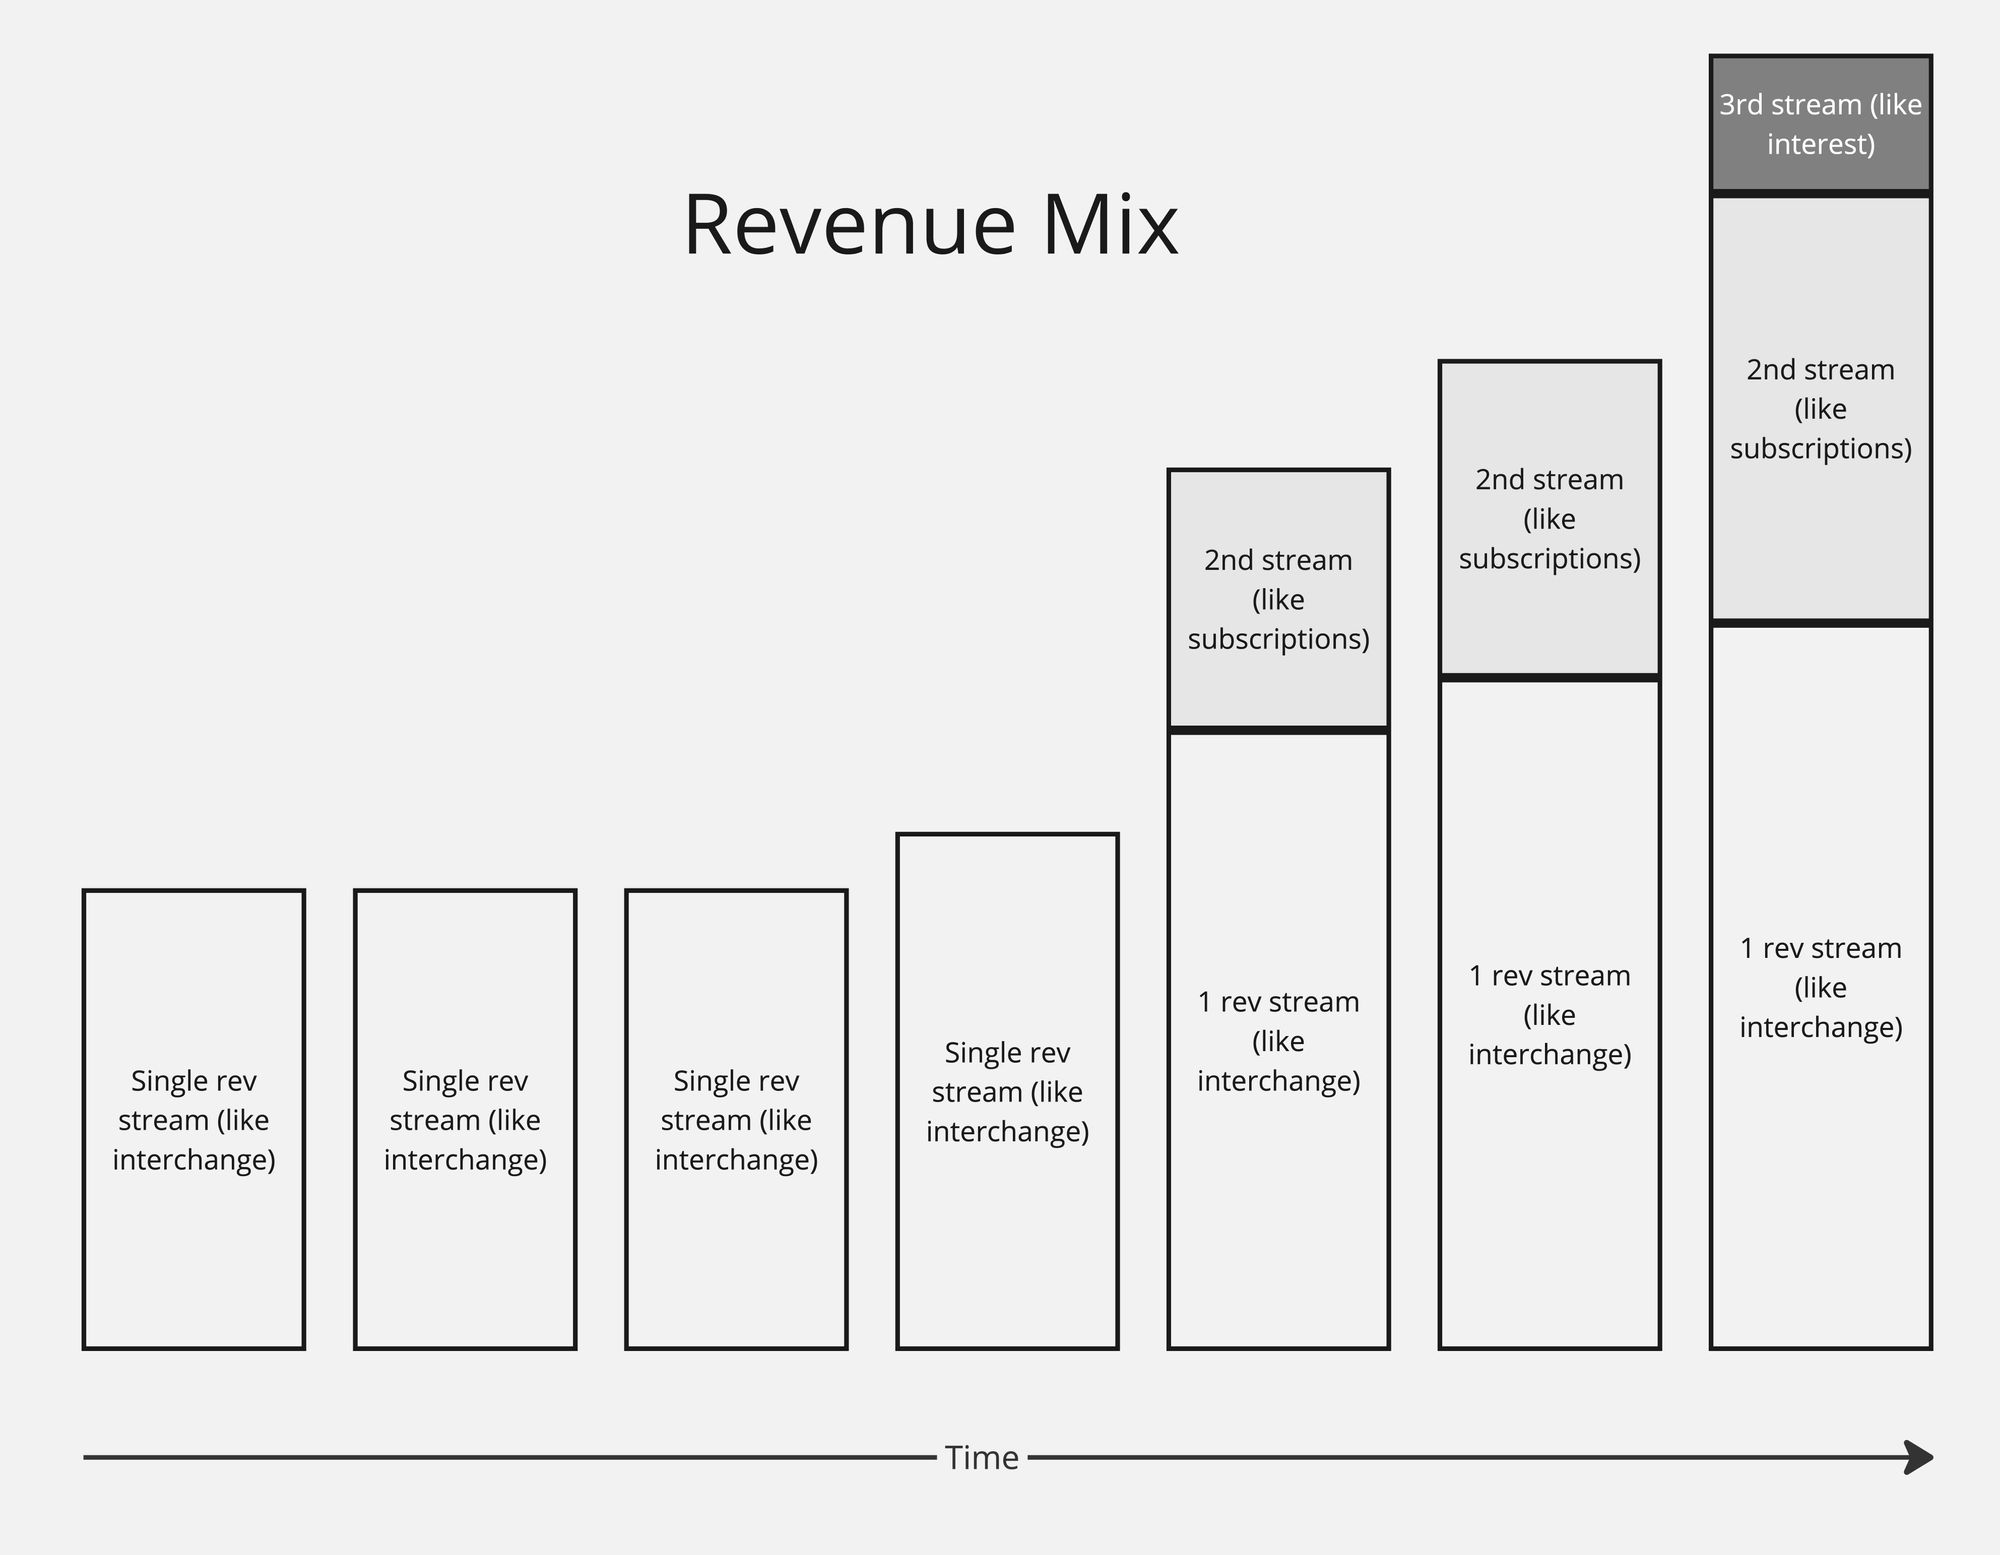
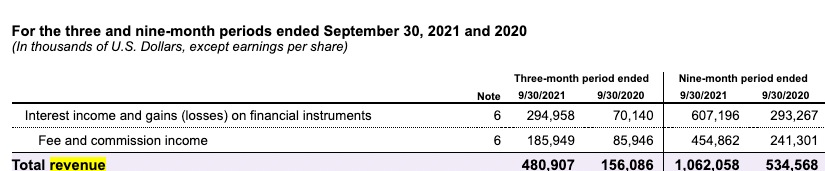
Common revenue streams include:
- Interest (earned on balances of cash and cash equivalents)
- Interest (charged on credit products)
- Interchange fees
- Subscription fees (saas platform fee, premium plans, etc.)
- Trading fees (per trade, spread on trx, commission, etc.)
- Payment for order flow
- Payment processing fees
- AUM fees
- Loan origination fees
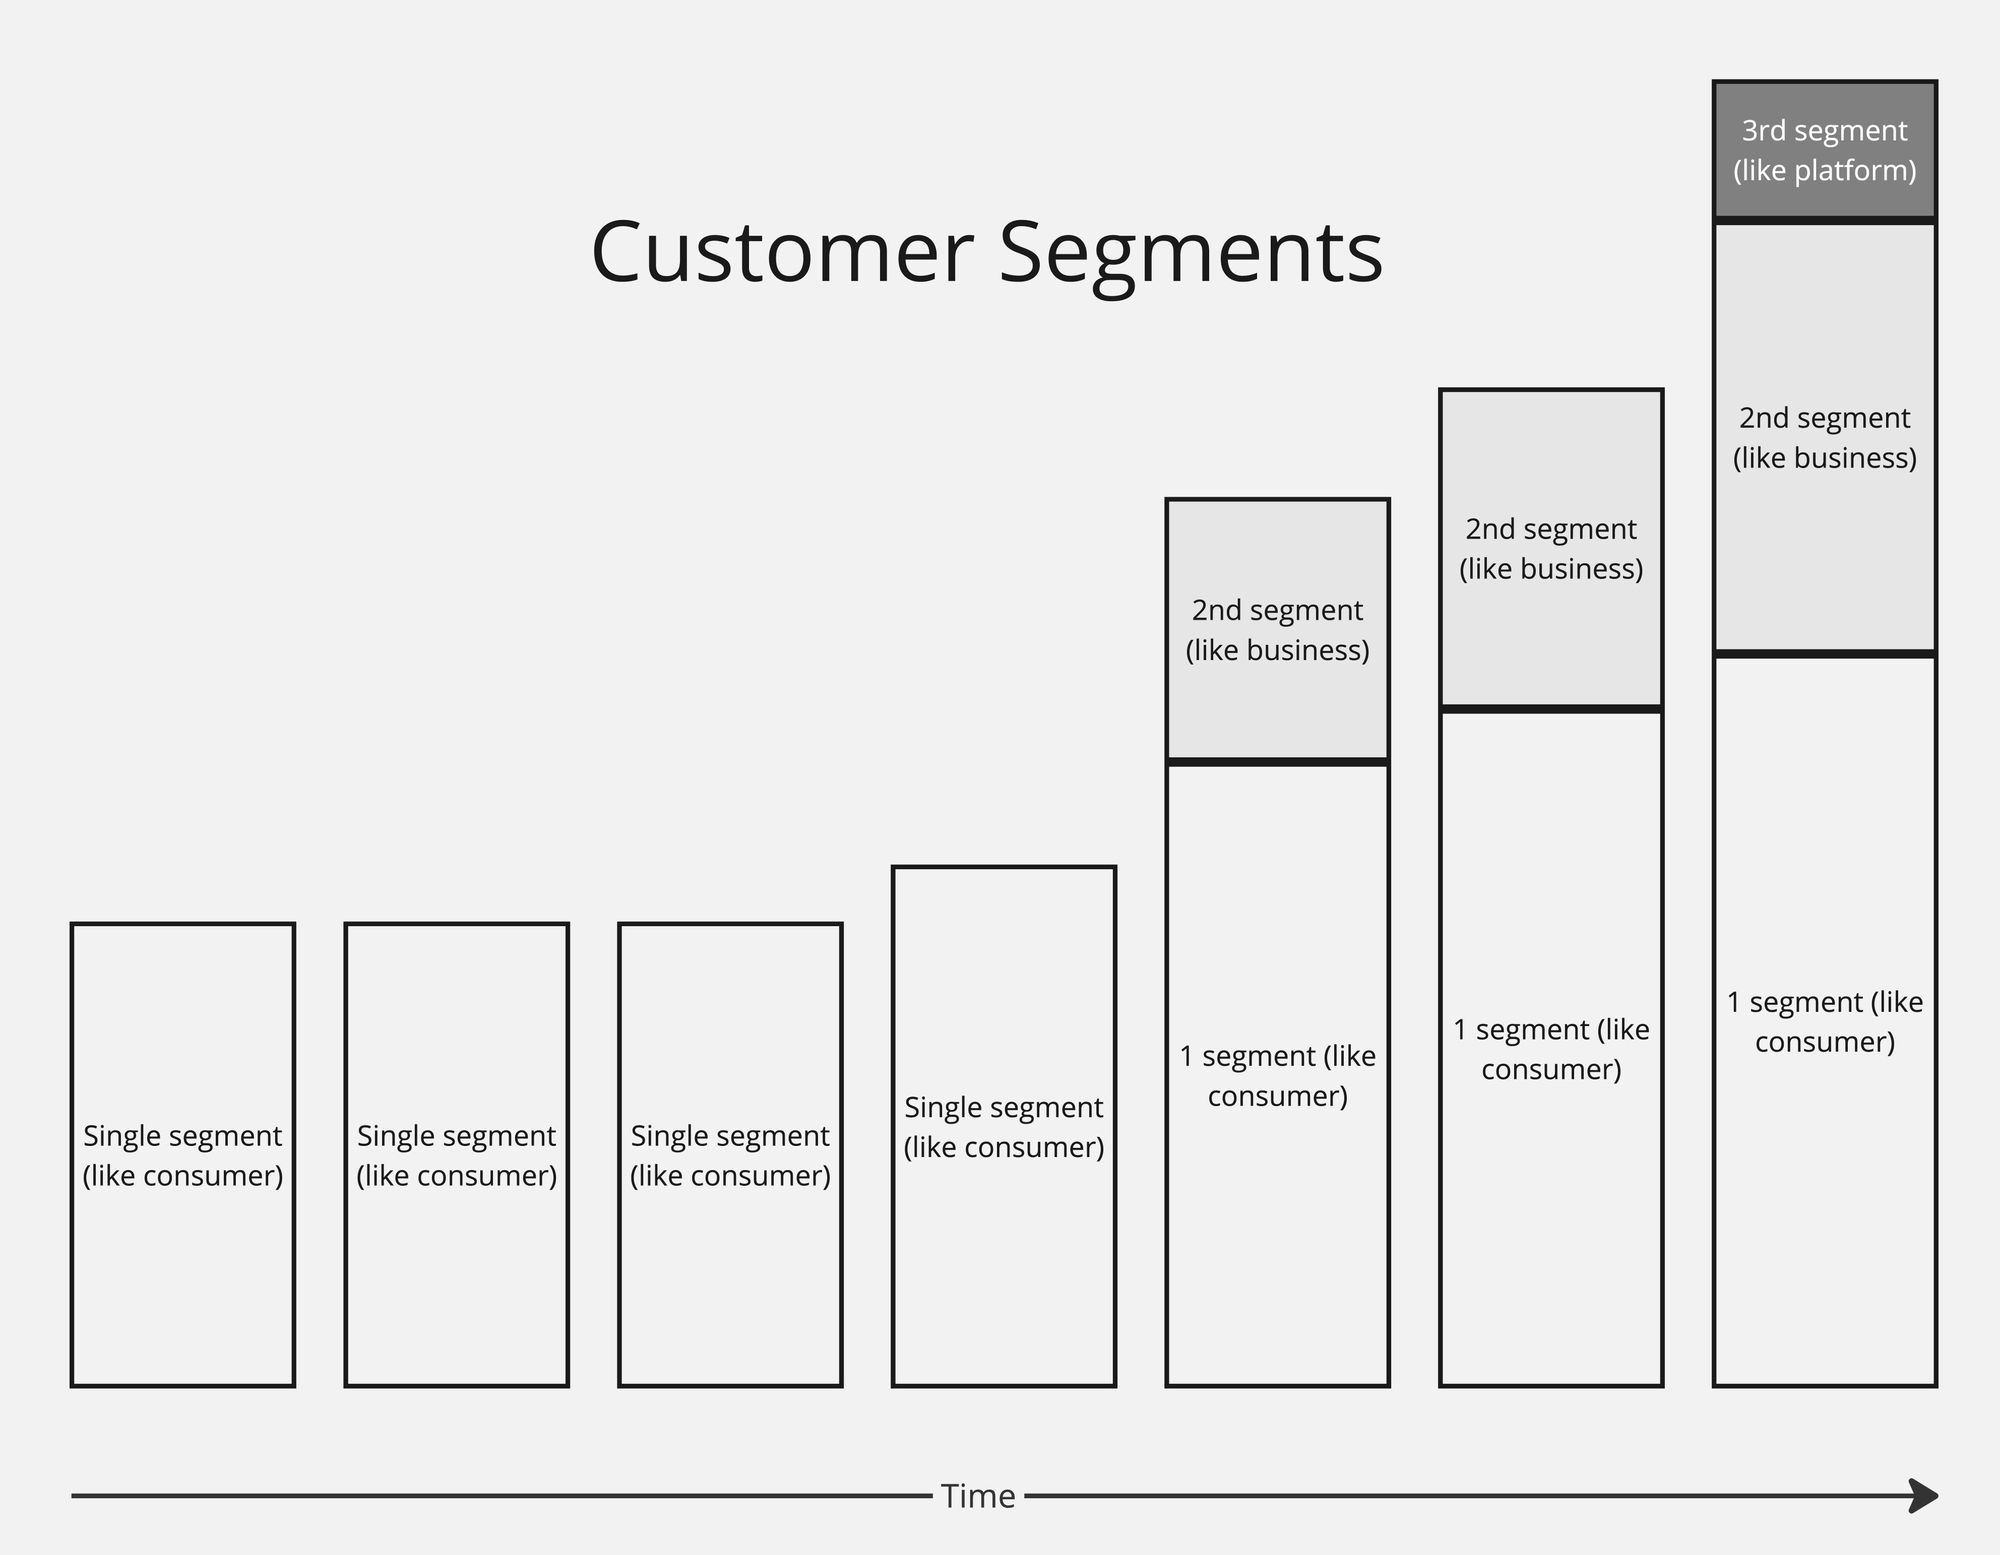
They may grow by expanding customer segments.
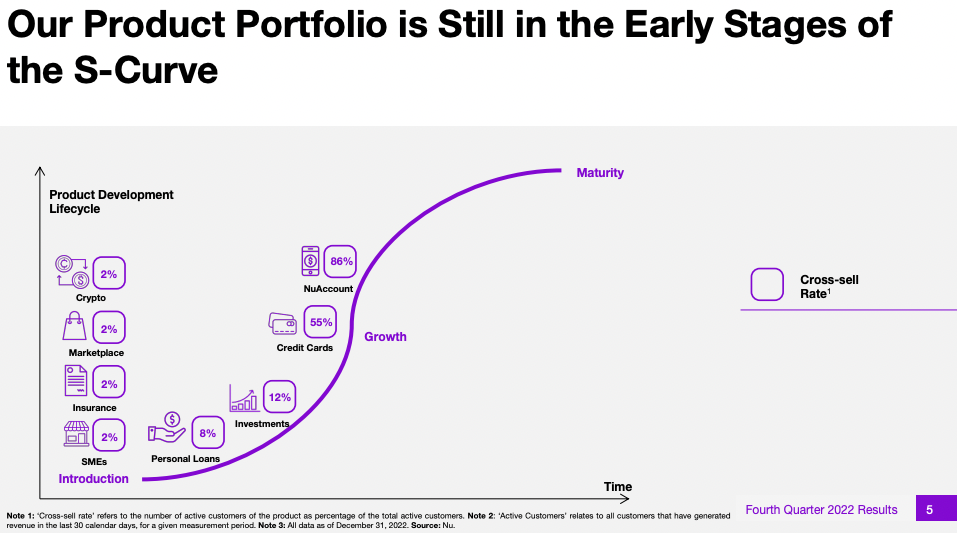
And they may grow by expanding to new geographies.

As all the charts above grow month-over-month or year-over-year, others likely are as well.
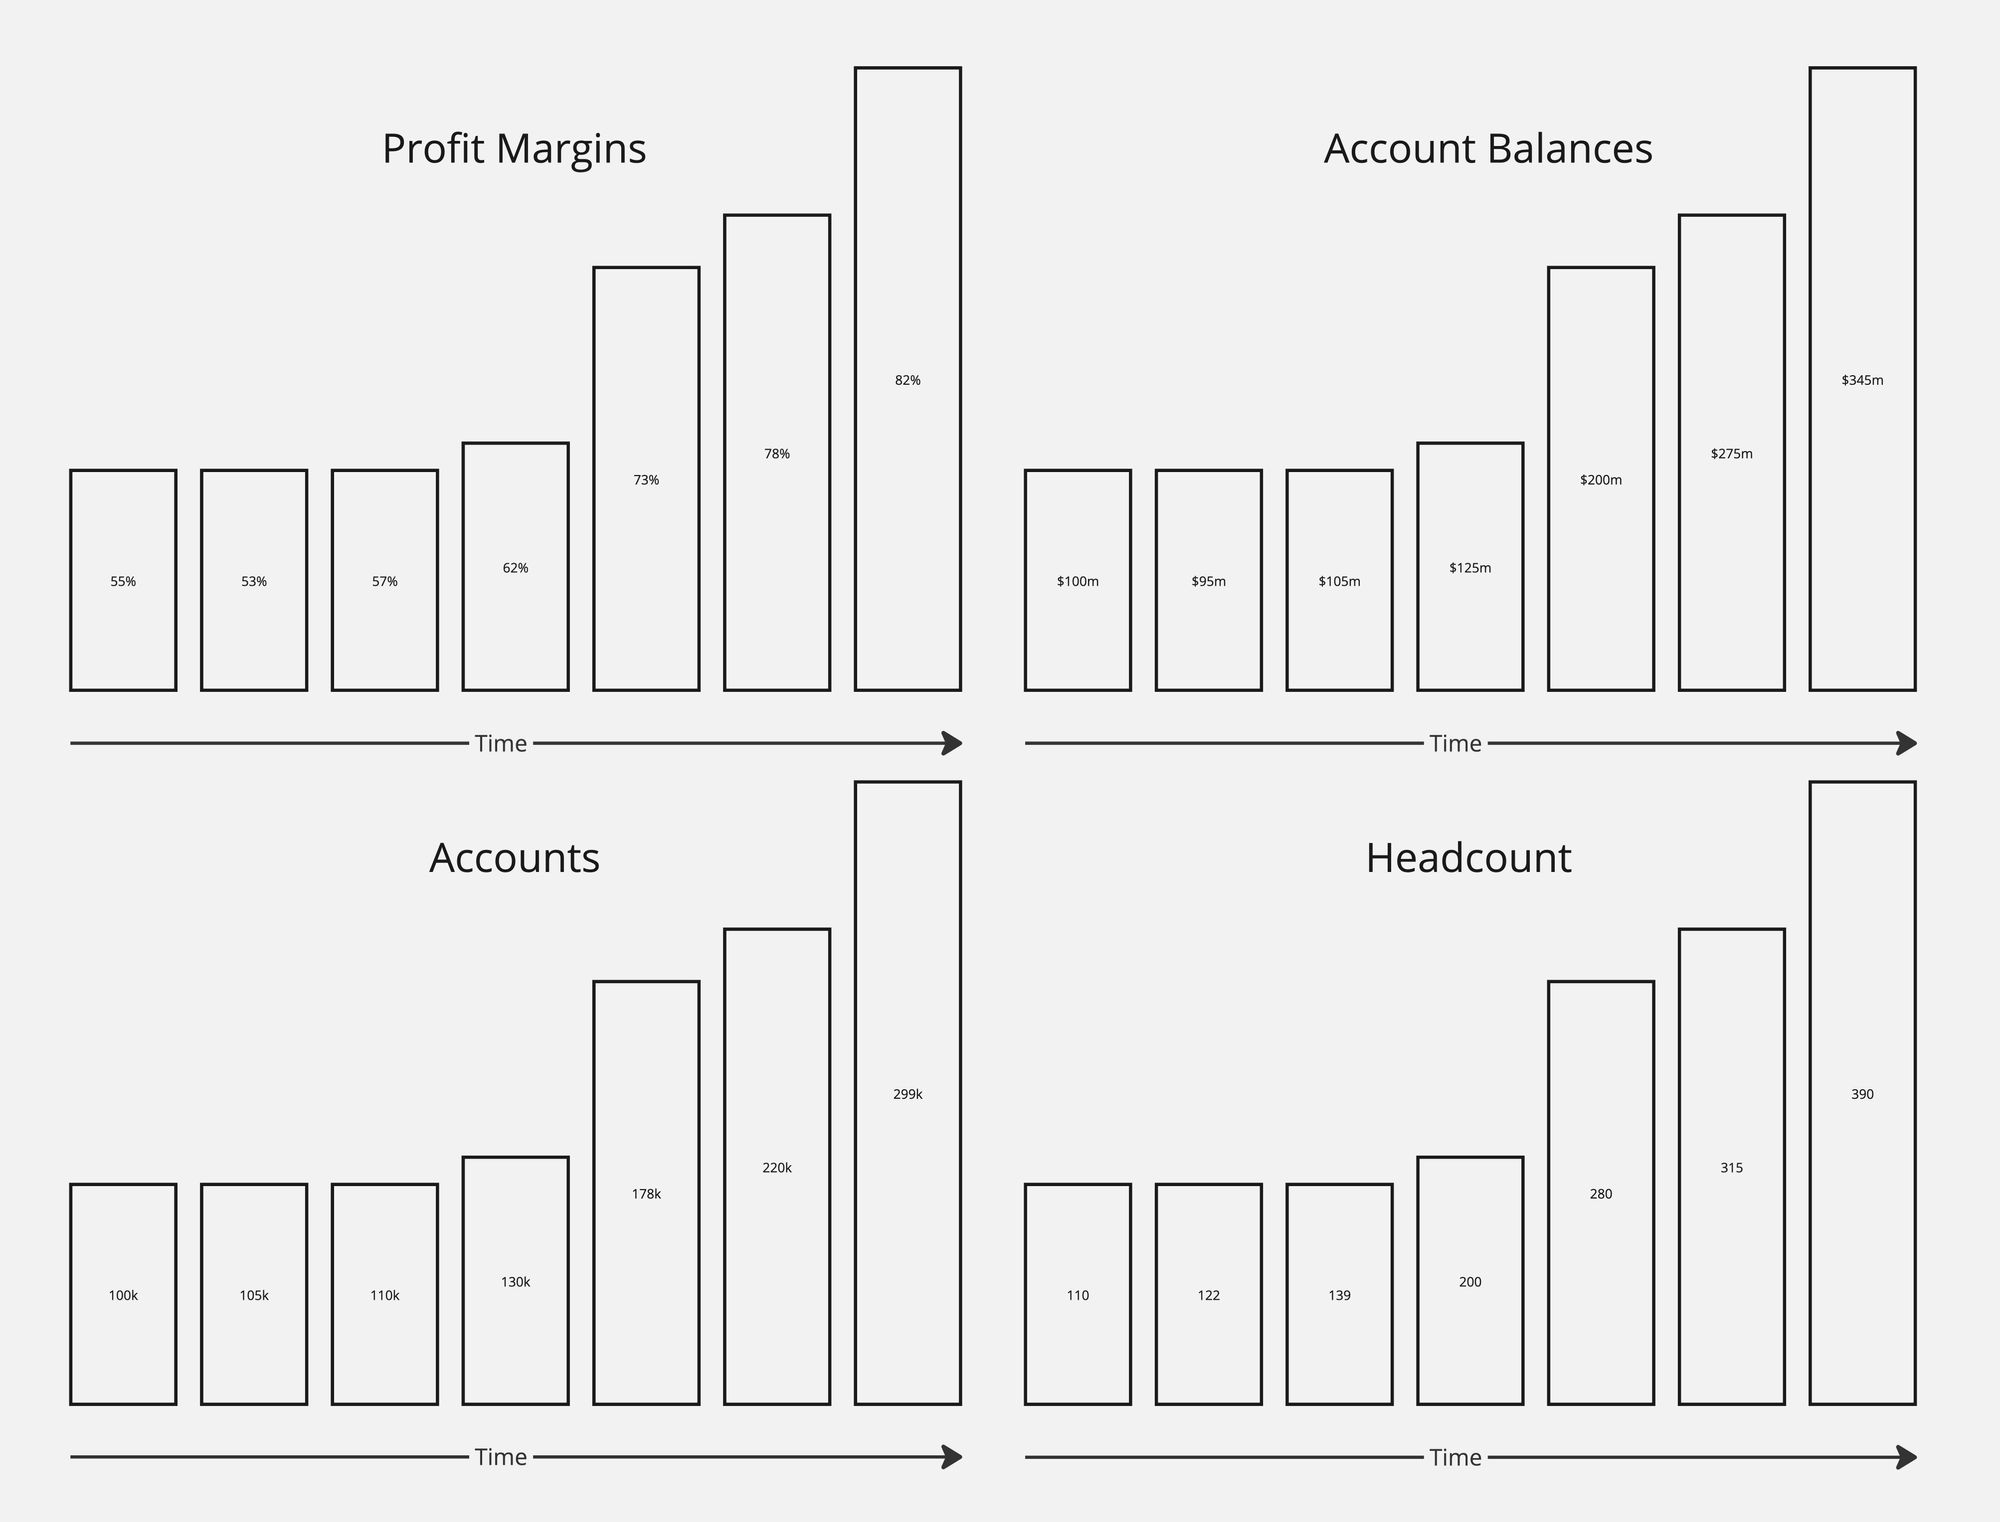
Let's take a look at a few real companies below.
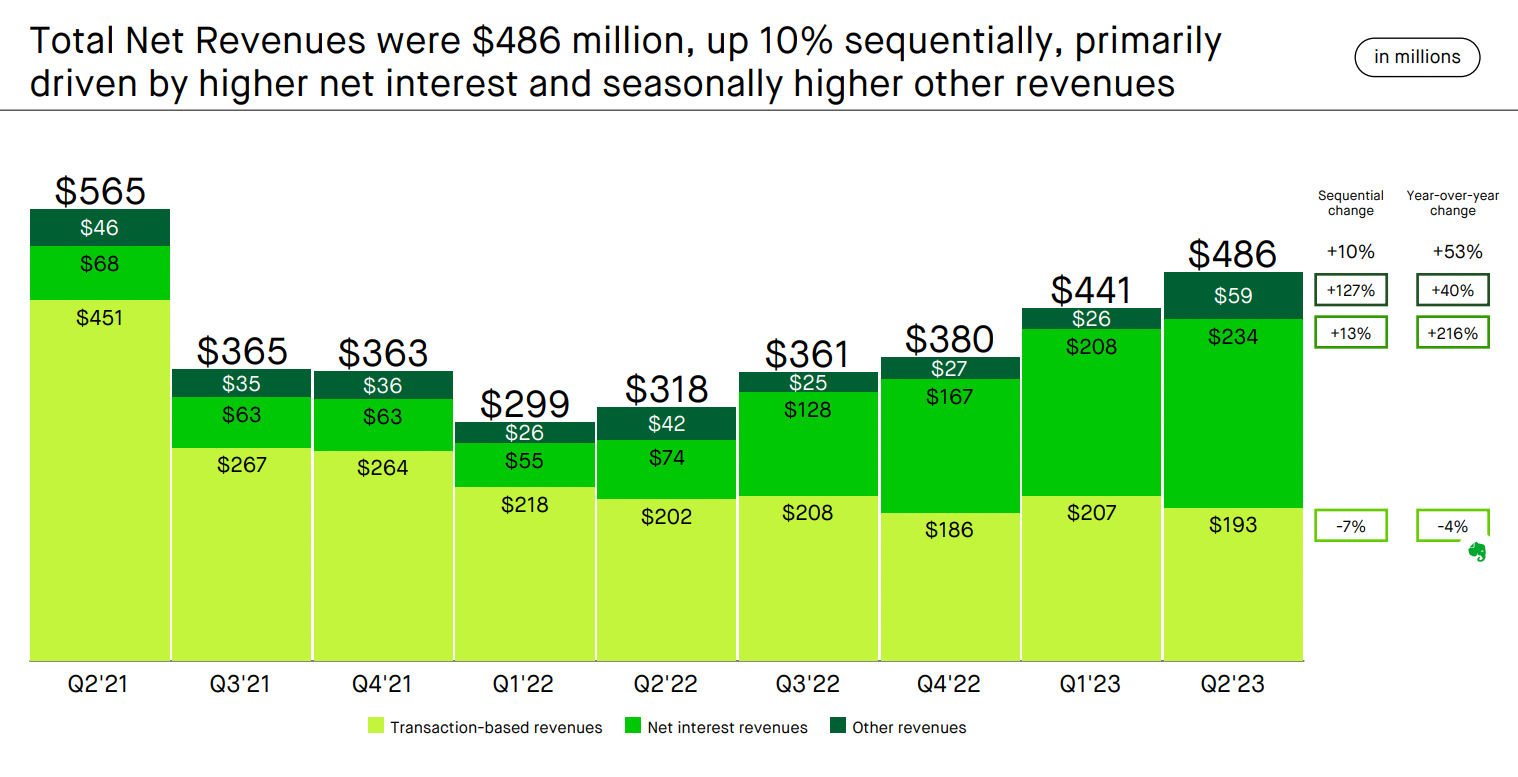
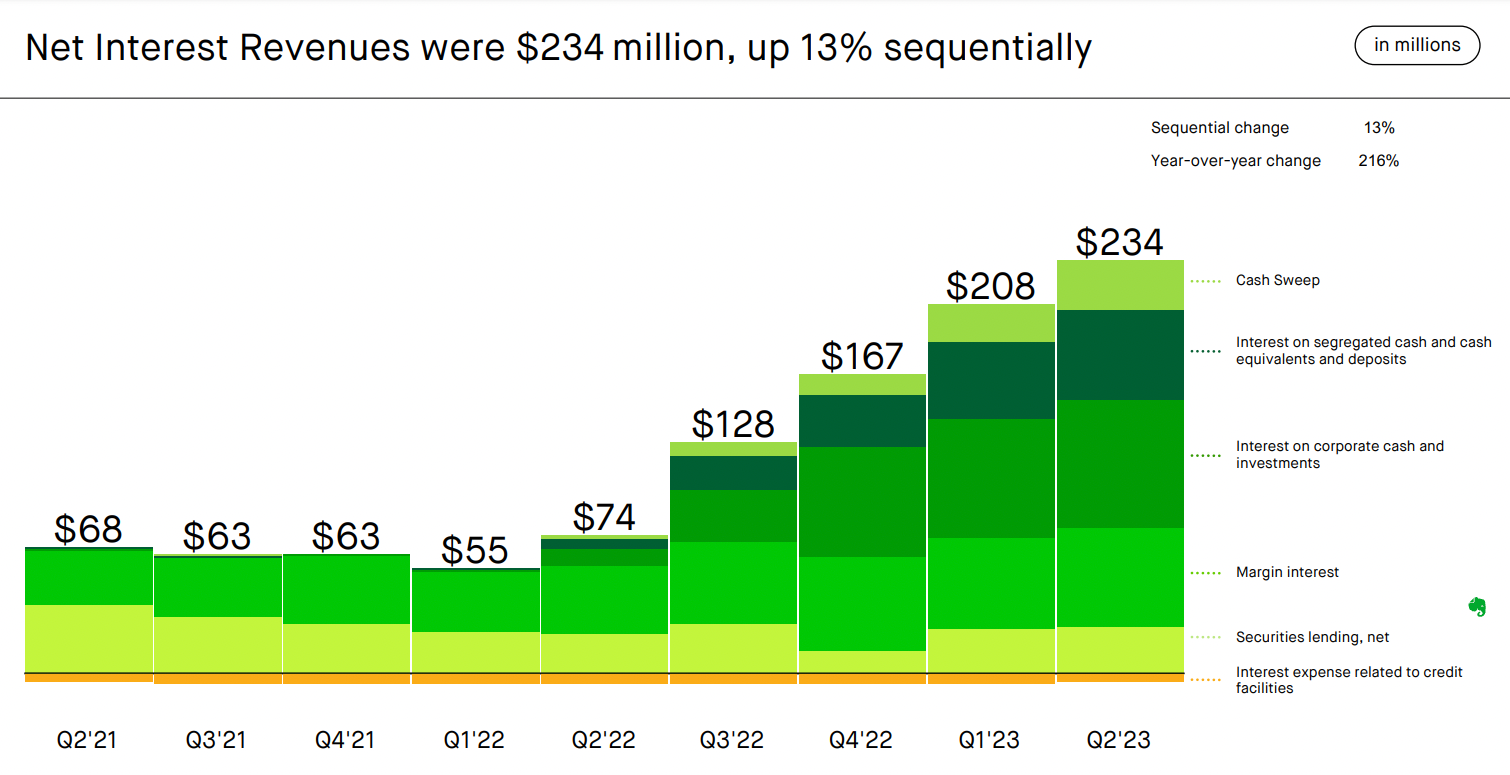
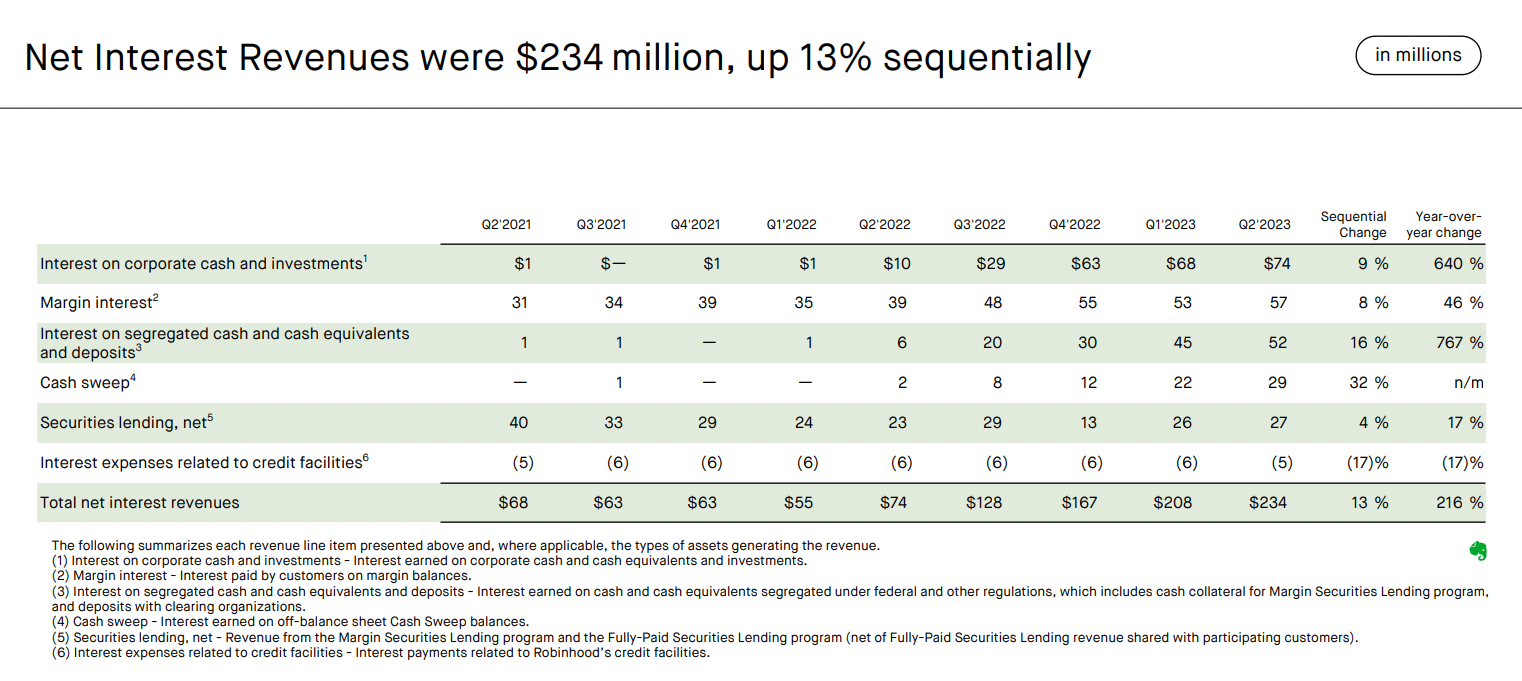
Robinhood
- Transaction-based revenue (PFOF, broken out by Equity, Options, Crypto, Other)
- Other revenue
- Interest revenue
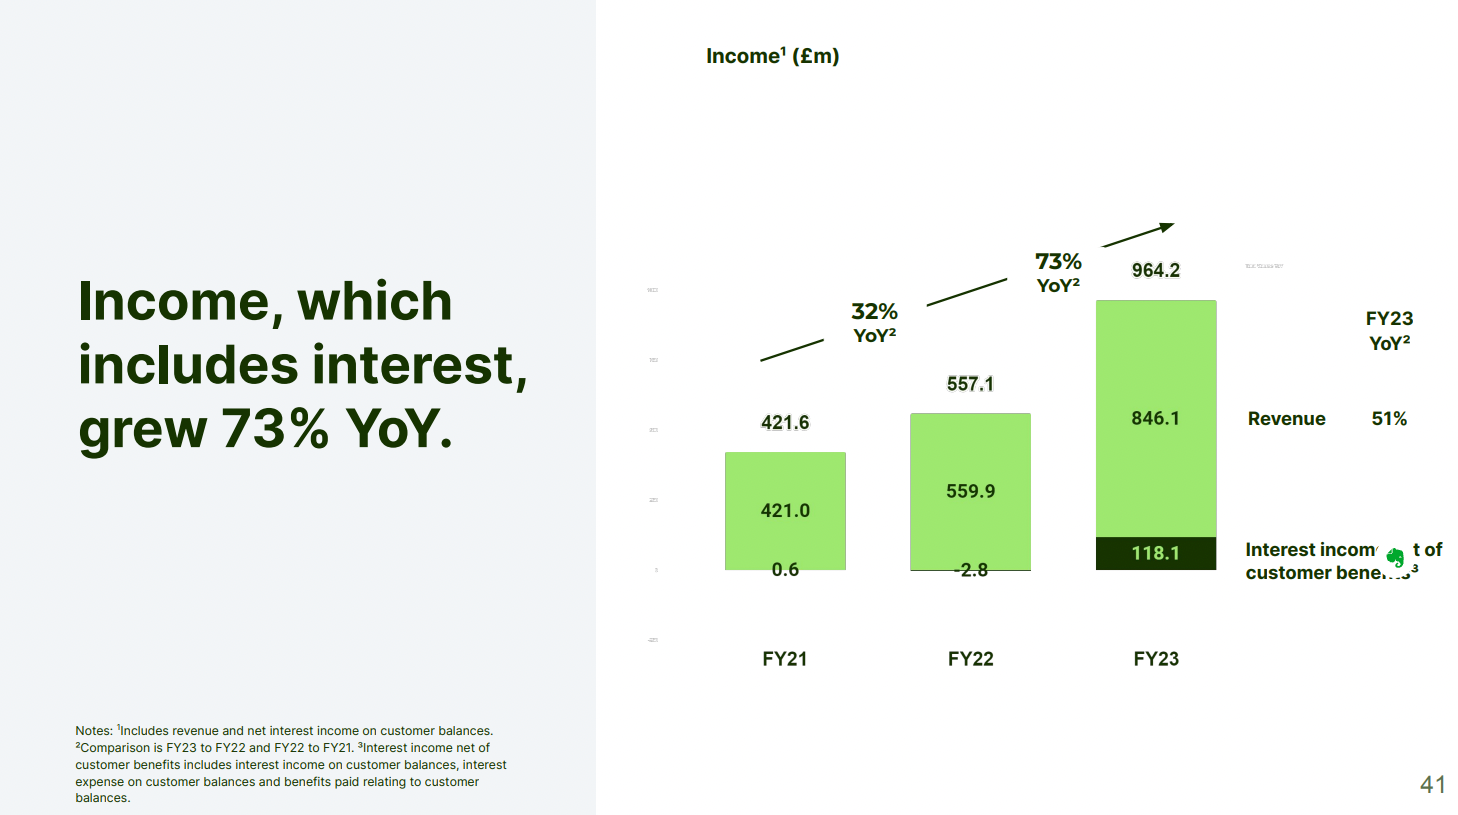
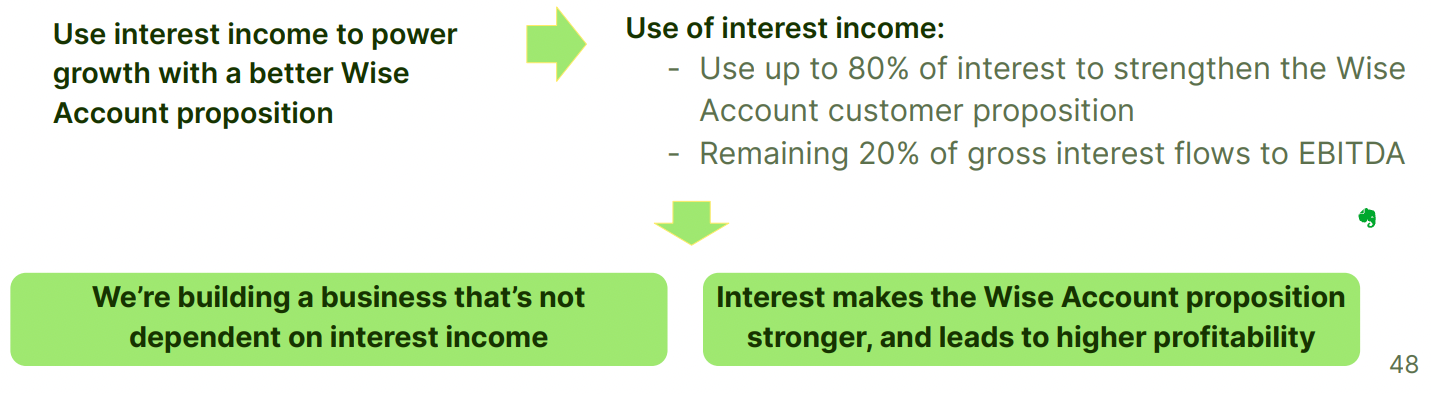
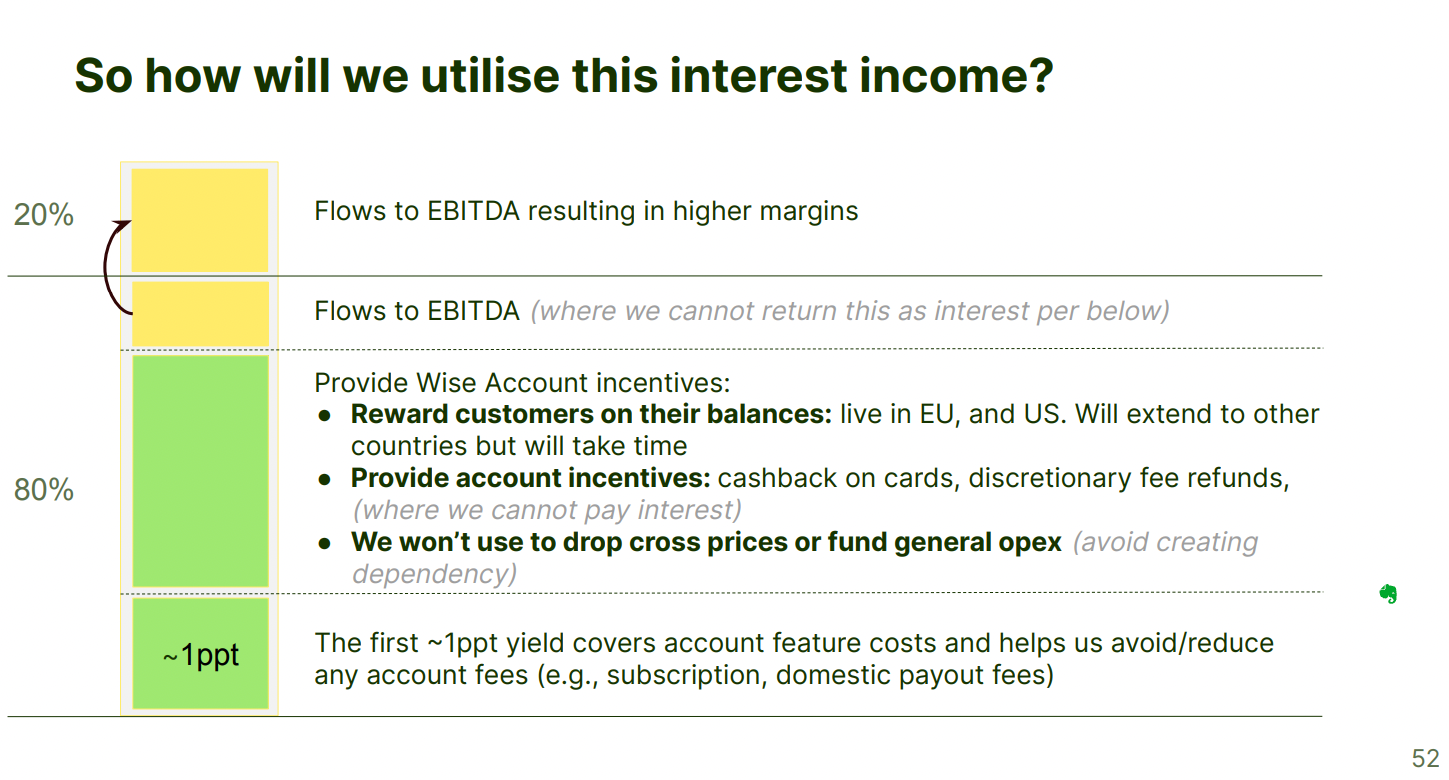
Wise
- Transaction-based revenue (cross-border)
- Other revenue (interchange from cards and fees on Consumer Account)
- Interest revenue (generated on funds customers hold in their accounts, close to evenly split between consumer and business accounts right now)
BILL
- Subscription fees
- Transaction fees
- Interest income
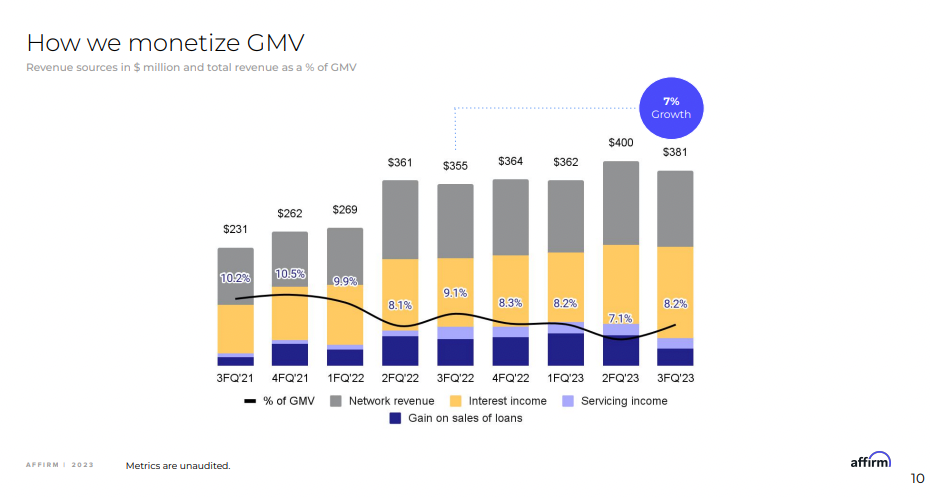
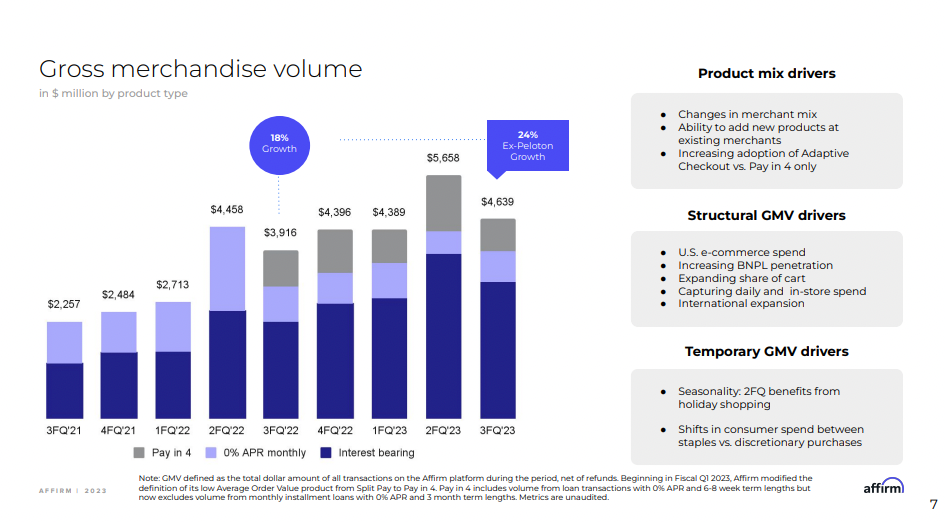
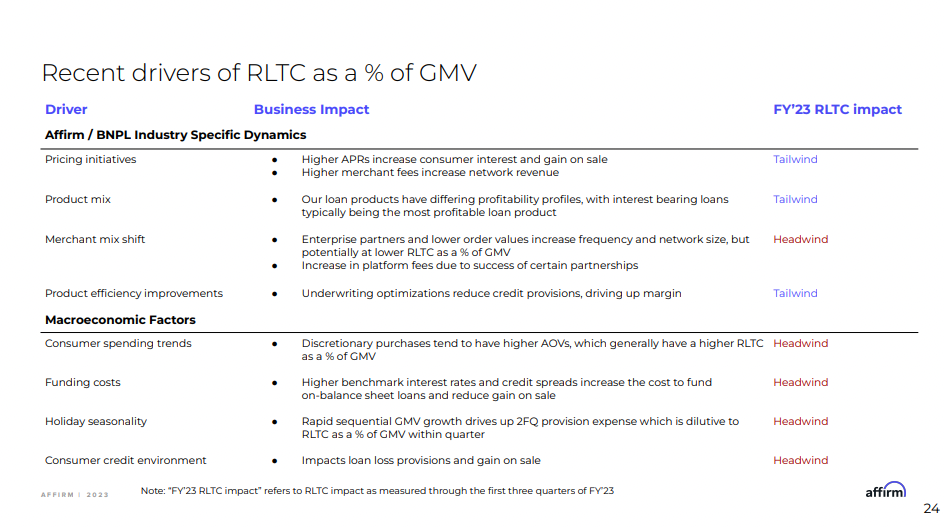
Affirm
- Merchant fees (merchants charged on each transaction)
- Interest charges (charged to consumers on their loans)
- Interchange fees (on virtual cards)
- Other (professional services for managing loans, sales of loans to 3rd parties)
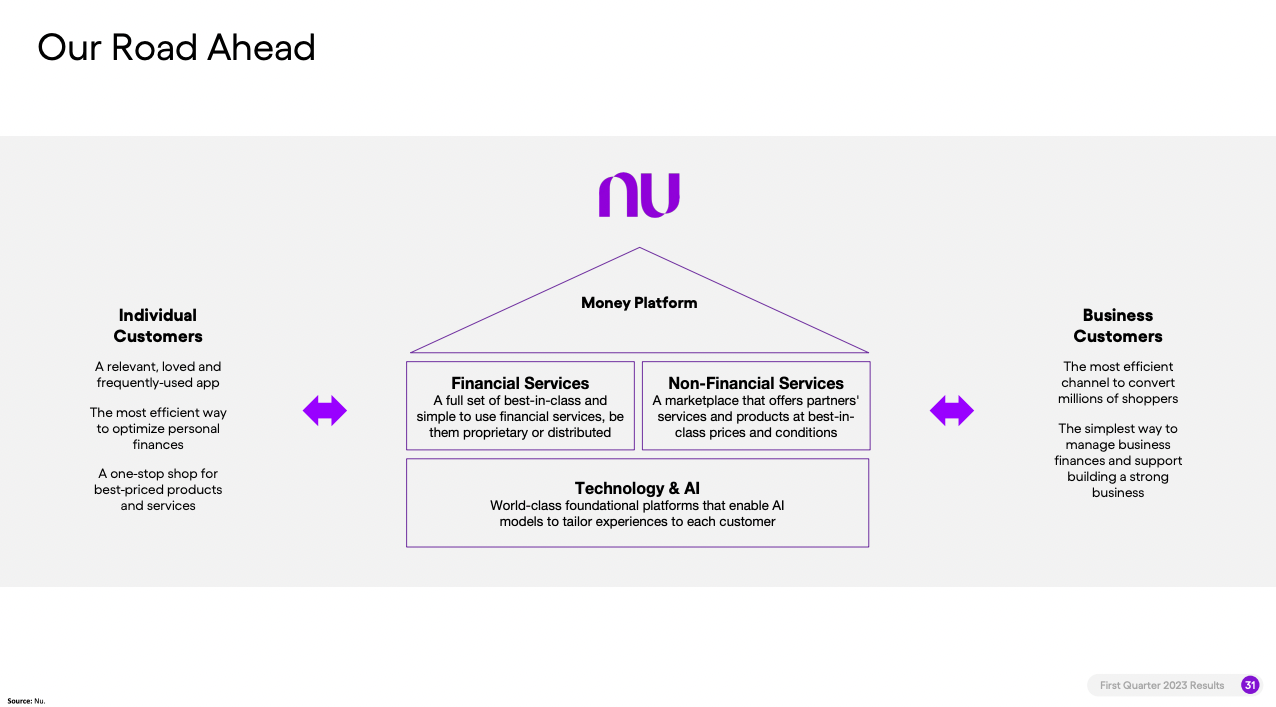
Nubank
One of the more fun and impressive product portfolios to track.
- Products: Credit cards, bank accounts, investments, personal loans, SME product, insurance, marketplace, crypto.
- Geo expansion: Brazil, Mexico, Colombia.
- Fees (transaction fees on credit and debit transactions, investment product fees, insurance brokerage fees, etc.)
- Interest charges (on revolving and refinanced credit card balances and personal loans)
- Other interest (earned on deposits, government bonds, and interest-earning instruments)
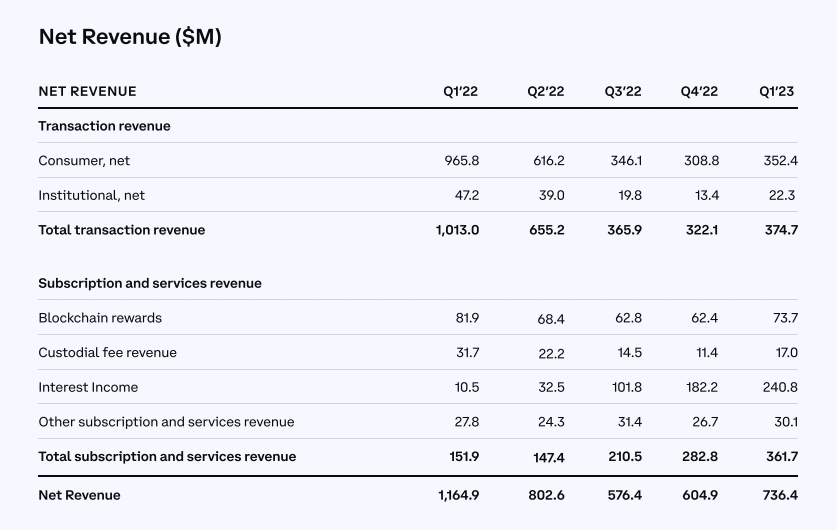
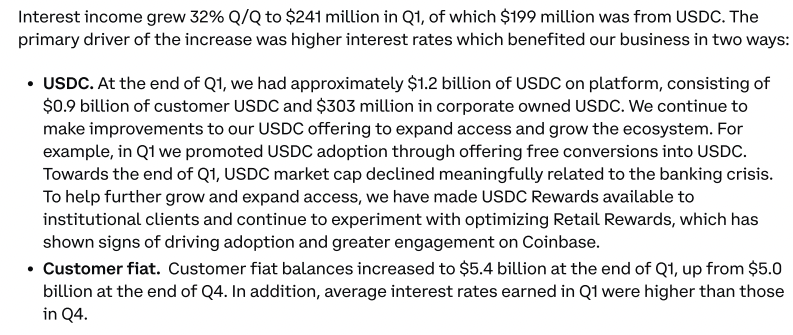
Coinbase
- Transaction fees (from consumers and institutions)
- Subscription & services (blockchain rewards, custodial fees, interest income, etc.)
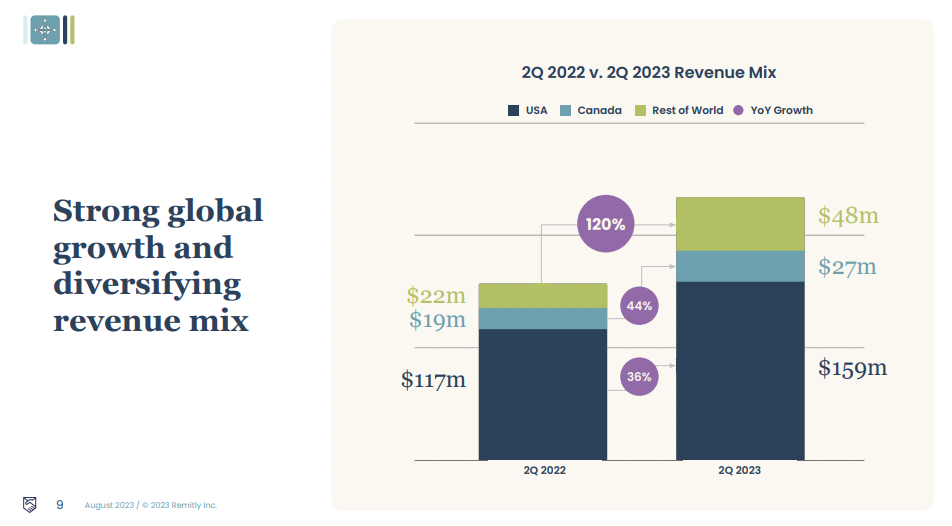
Remitly
Recent stated priorities include geographical expansion and new products.
- Transaction fees (charged to customers)
- FX spreads (between the FX rate offered to customers and the FX rate on the currency purchases)
- Interest (earned on cash and cash equivalents)
References
- Robinhood Q2 2023 Earnings Prezo
- Wise FY2023 Results Prezo
- BILL May 2023 Investor Prezo
- Affirm June 2023 Financial Model Prezo
- Affirm Q32023 Earnings Supplement
- Nubank F-1
- Nubank Q4 2022 Earnings Prezo
- Nubank Q1 2023 Earnings Prezo
- Coinbase Q1 2023 Earnings Prezo
- Coinbase S1
- Remitly S1
- Remitly Q2 2023 Investor Prezo
- Horizontal vs. Vertical
- Payments Plus